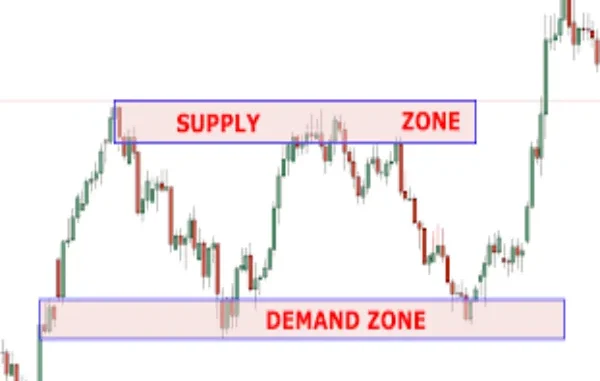
When looking at the price charts for a certain time, you notice that the price tends to create zones where it behaves strangely. Areas where prices stalled or reversed due to excess buyers (demand) or sellers (Supply), are called supply and demand zones, and understanding them can provide you with a significant edge in trading. The zones differ from traditional support and resistance zones, and we are going to decode supply and demand zones in this guide by analyzing the science behind these important areas.
Core principles of supply and demand zones
A classical supply-demand zone heavily reflects economics in a market structure. In a sense, the supply and demand zone is applied macroeconomics. The classical model suggests that price finds equilibrium where supply (sellers) meets the demand (buyers). A surplus occurs above equilibrium, pushing prices down, and a shortage occurs below equilibrium, driving prices up. A surplus is an excess supply, and a shortage is an excess demand.
Demand zones
Price levels where buying pressure overwhelms selling pressure are demand zones. This aggressive absorption of sell orders causes bullish spikes.
Supply zones
Price levels where selling pressure is stronger than demand. This overwhelms buyers, stopping rallies and causing bearish reversals. Think of it as a price ceiling where sellers consistently win.
The main reason for these spikes is order flow imbalance, primarily caused by institutional players. Large orders by banks and hedge funds can not be filled immediately, and they are typically clustered around key levels, creating zones of latent liquidity. When the price moves quickly from a consolidation area, it leaves behind unfilled buy or sell orders. This creates an imbalance, and the price is often drawn back to resolve. This is the core philosophy behind supply and demand zones.
Scientific foundation
The key scientific foundation lies in asymmetric information and latent liquidity. Asymmetric information is when institutions act on information or needs that are unknown to retail clients. These actions include hedging, portfolio rebalancing, and so on, and tend to concentrate their orders, causing imbalances.
The psychology
Supply and demand zones are manifestations of collective market psychology. There are several psychological phenomena like anchoring bias, FOMO, and capitulation. The anchoring bias is when traders mentally fixate on price levels where past reversals occurred, and it draws attention and order flow back to these areas. FOMO, or fear of missing out, can cause panic buying above the demand zone, which creates a new supply zone. Capitulation causes panic selling below the supply zone, potentially resulting in a new demand zone. Another phenomenon caused by retail traders is called stop-loss clustering, where they often place stops just below demand zones or above supply zones. When the price retests these zones, it triggers these clustered stops, resulting in a surge amplifying reversals.
Unlike traders, institutions share these zones directly. As large players leave unfilled limit orders (buy orders below price, sell orders above), which are clustered in zones, they create pools of latent supply or demand.
How to spot supply and demand zones
Spotting these zones is trickier than defining support and resistance zones. Traders use extended sideways movements to spot zones of consolidation first. This is called the base and indicates accumulation or distribution. Accumulation is when buyers absorb supply, and distribution is where sellers meet demand. Accumulation – potential demand zone, distribution – potential supply zone. To spot these zones, traders should look for distinct patterns like a strong rally followed by a short consolidation (base), when a sharp drop away from the base. The base is a supply zone. A strong drop followed by a short consolidation (base), then a sharp rally away from the base. The base is a demand zone.
The bottom line
Supply and demand zones offer a deeper look into price action than traditional support and resistance levels. They reflect not just price levels, but hidden institutional activities, trader psychology, and order flow imbalances. By identifying these zones, traders can gain an edge in financial trading and turbocharge their performance.
Leave a Reply